
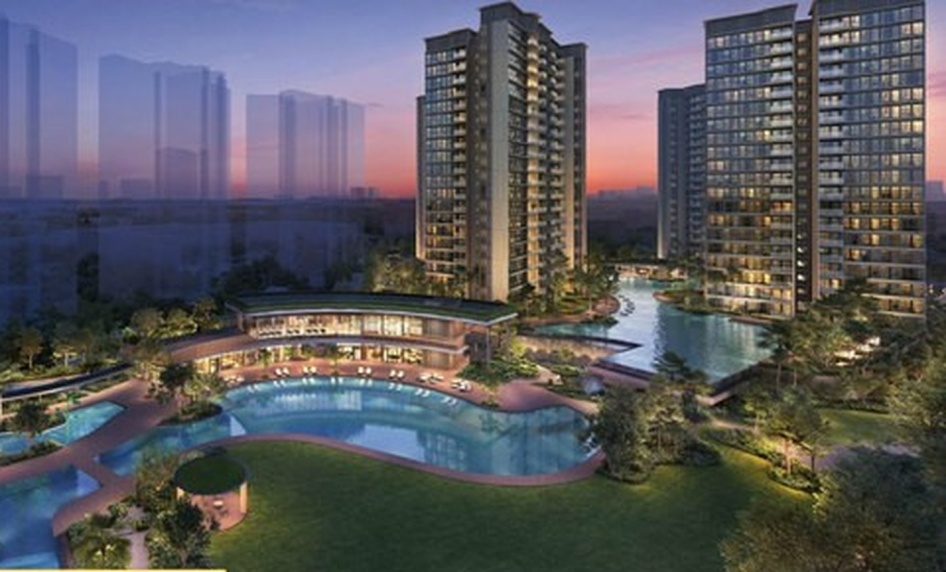
Upgrade or wait in 2026? I start with a method for assessing the market, prices and our own circumstances. As global conditions become more complex, it becomes more important to distinguish broad trends from the specific value of an individual home.
In my 19 October presentation, I began with AI, US–China competition and inflation, before discussing Singapore’s population, wealth, land and everyday living efficiency. This article follows the same logic: macro trends tell us what to watch, data helps test our views, and family cash flow and entry price determine the next step.
I hope to offer an investment decision framework that helps people understand the market and assess prices. Kevin Feng · Opening remarks, 19 October 2026 presentation; edited from spoken delivery
This article retains ten core data charts and their original credits from the presentation. Each chart explains its message, my interpretation and its relevance to buyers. Dates, sources and statistical definitions appear in the captions; historical data, future targets and pricing scenarios are distinguished. Click each image to enlarge it.
Global change reinforces Singapore’s role in wealth and asset allocation.
AI, US–China competition and inflation are the three themes I use to understand the macro environment. For homebuyers, their effects ultimately pass through employment, wealth accumulation and the cost of the next development cycle.
AI investment creates new sources of growth and wealth.
AI drives investment in computing, infrastructure and industrial upgrading. In my view, Singapore’s international connectivity, professional services and talent advantages position it to participate in this investment cycle, supporting housing purchasing power through business growth, employment and incomes. [1]
De-risking prompts capital and talent to reconsider where they locate.
I view US–China competition as a long-term contest in technology and industry. Companies are reorganising headquarters, research, supply chains and capital. In my view, Singapore’s stable institutions and global connections make it an important long-term destination for capital and talent, also supporting local housing demand.
Inflation and development costs change the pricing base for new homes.
Land, materials and labour determine the starting cost of future supply. In assessing residential value, I consider how these costs may reshape subsequent launch prices. Buyers should assess their own holding capacity against actual mortgage quotations and household income.
| Indicator | 2026 | 2027 |
|---|---|---|
| Global real economic growth | 3.1% | 3.4% |
| Global headline inflation | 4.7% | 4.1% |
Source: IMF October 2026 WEO, using information available up to 1 October 2026. These global indicators are not forecasts of Singapore’s growth, inflation or housing prices. [1]
Local context: the MAS statement of 14 October 2026 forecasts core inflation of 1.5%–2.0% and headline CPI of around 2.0% for 2026. Singapore’s monetary policy is centred on the exchange rate. These are forecasts and policy context. [2]
Share in Singapore’s growth to understand the long-term value of housing.
To understand home prices, I start with Singapore’s long-term capacity to create wealth. Economic development, accumulated wealth and housing purchasing power form the foundation of my assessment of long-term residential value.
Economic growth and home prices: a shared long-term direction
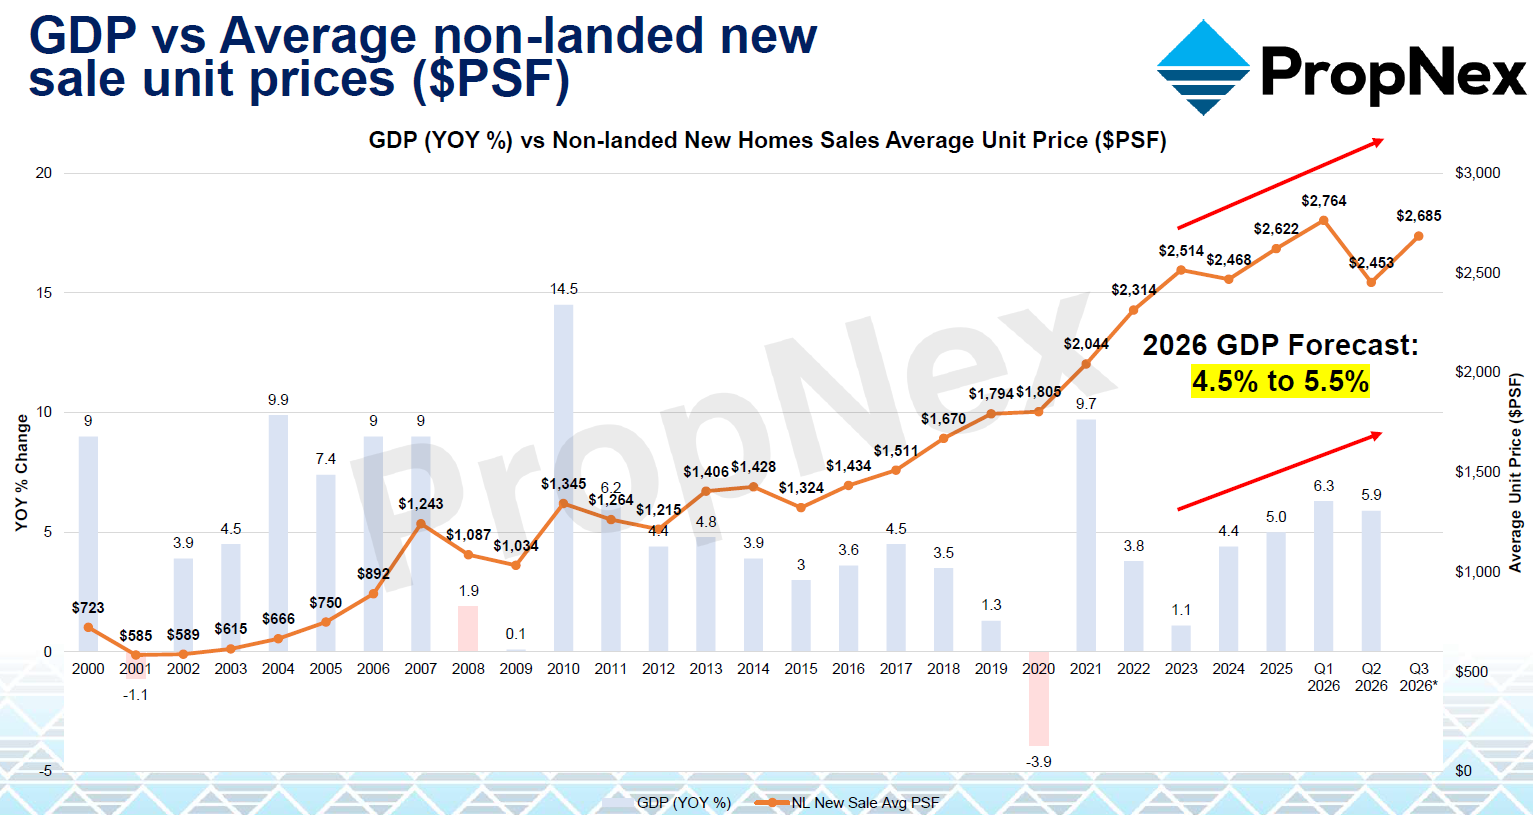
Source:Original chart: PropNex presentation materials, reproduced from the author’s supplied latest presentationslide 18.
Interpretation limits:The left axis shows GDP growth; the right axis shows average new-sale non-landed residential prices per square foot. The axes use different scales, and average prices are affected by the mix of projects and layouts sold. The chart cannot establish causation.
Click to view the high-resolution original ↗
Over the long term, Singapore’s economic development and rising home prices have followed a broadly similar direction. Growth supports incomes, wealth and purchasing power, with higher residential values forming part of that process. My view is that Singapore’s long-term wealth-creation capacity and residential value are positively related over time.
For buyers, growth in long-term purchasing power is an important foundation for assessing residential asset value.
Continuing wealth growth provides long-term support for housing
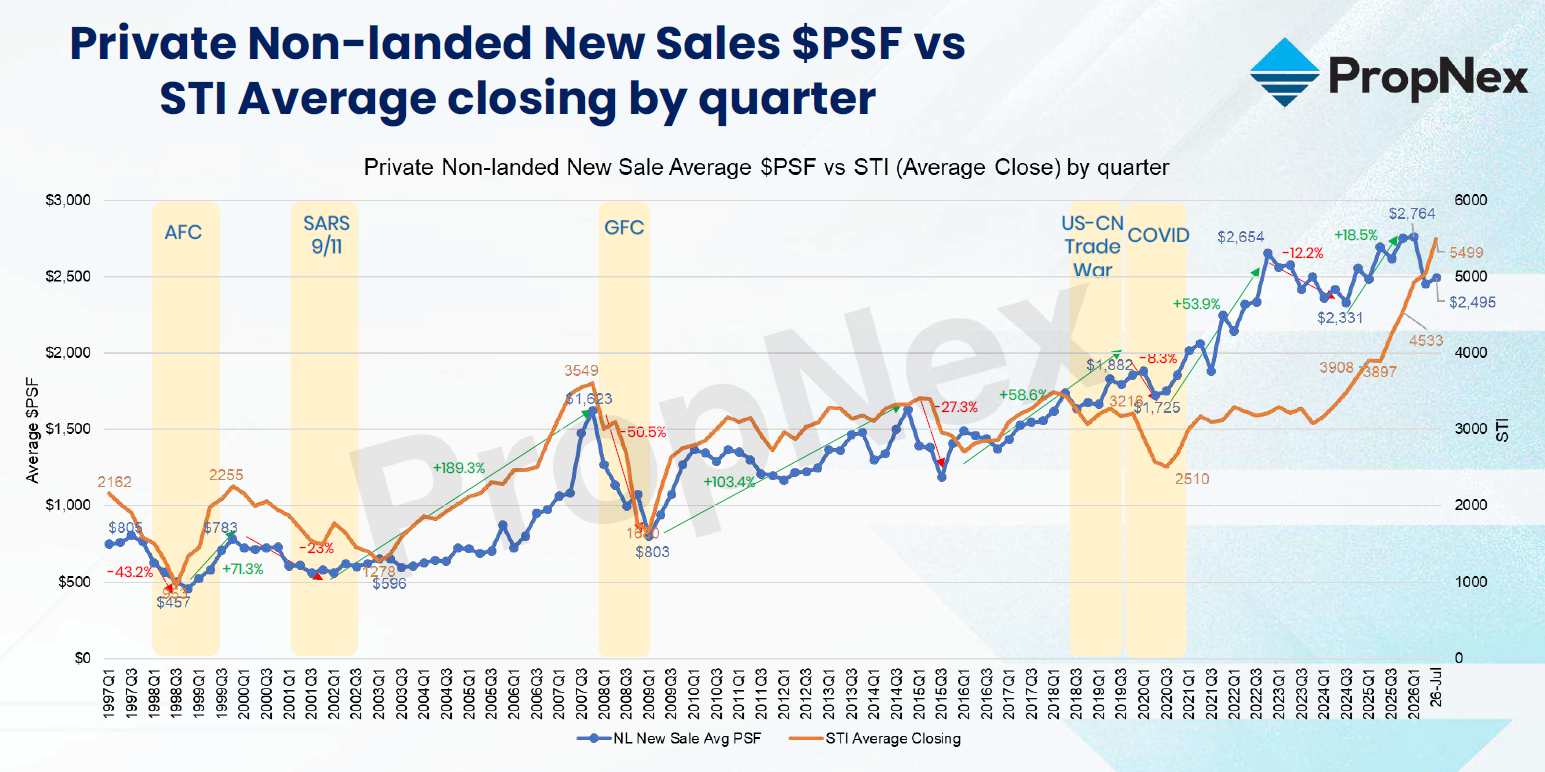
Source:Original chart: PropNex presentation materials, reproduced from the author’s supplied latest presentationslide 19.
Interpretation limits:Quarterly STI averages are shown alongside average new-sale non-landed home prices. Shaded crises provide historical context. Equity liquidity, sector weights and the lag in residential transactions differ.
Click to view the high-resolution original ↗
Equities and property are both vehicles for wealth growth. Their short-term performance varies: equities lead in some periods, while property is stronger in others. Over a longer horizon, both reflect Singapore’s economic development and wealth accumulation. My focus is the long-term support that sustained wealth growth can provide to housing.
In my view, accumulated wealth supports families’ housing improvements and residential asset allocation. The assets have different cycles; this view does not require equal returns or converging prices.
Population-driven demand continues to grow; new supply determines market tightness.
Citizenship, permanent residence and population policy support long-term housing demand
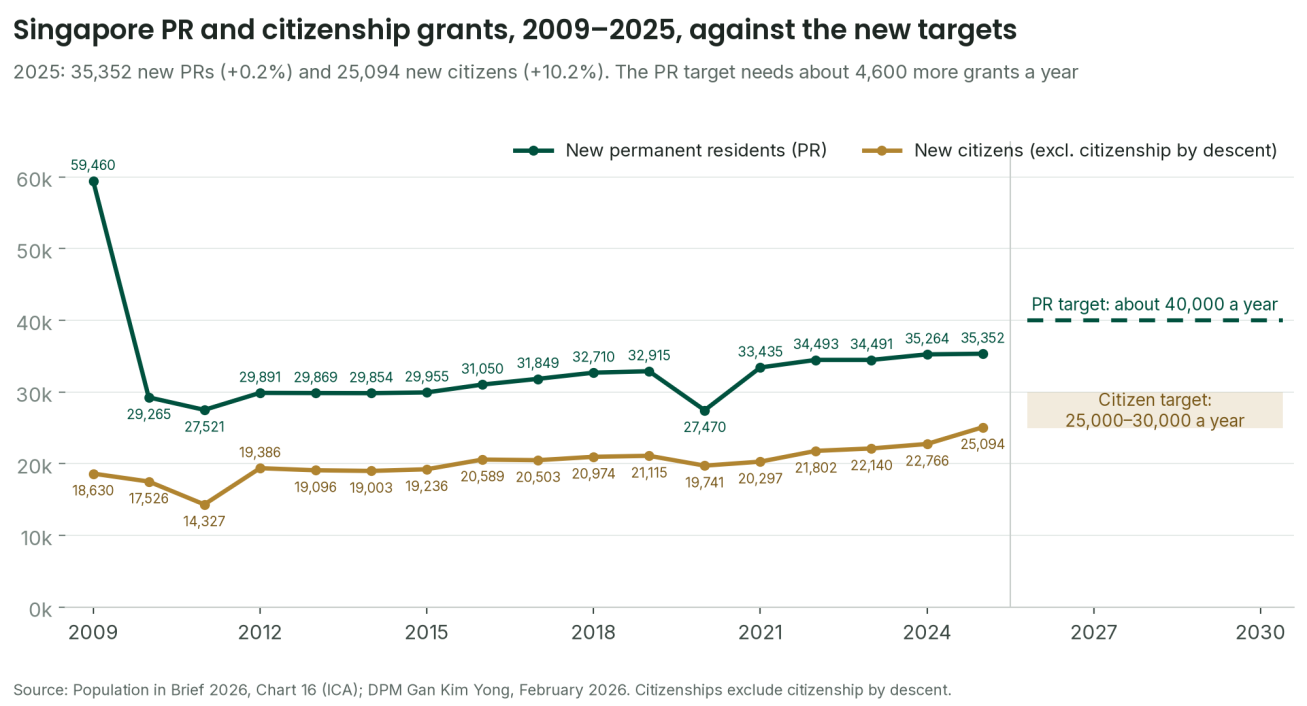
Source:Original chart credits: Population in Brief 2026 / ICA and a February 2026 policy speech; reproduced from the author’s supplied latest presentationslide 16.
Interpretation limits:The chart shows 25,094 new citizens and 35,352 PR grants in 2025. New citizens exclude citizenship by descent overseas. People moving from PR to citizen status may appear in different years’ grant flows; the figures cannot be added and treated as net population growth or new homebuying households.
Click to view the high-resolution original ↗
Singapore continues to welcome new citizens and permanent residents, with population policy supporting long-term housing demand. Considering the grant trends and future policy targets shown, my view is that population-driven housing demand continues to strengthen.
Historical grants describe status changes that have occurred; future targets indicate policy direction. For buyers, they suggest continuing support for long-term residential demand.
Unsold new homes: watch replenishment and the supply–demand cycle
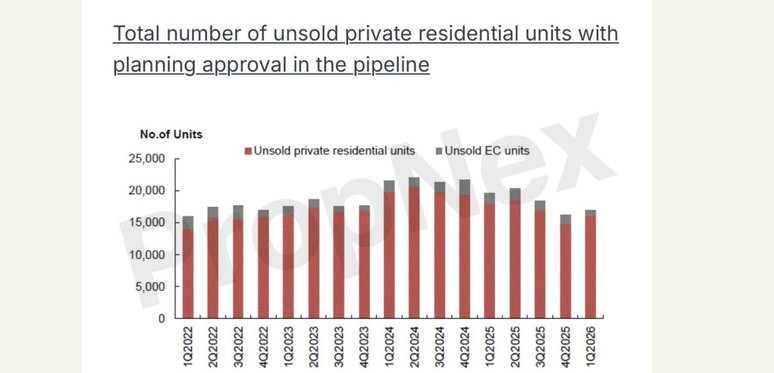
Source:Original chart: PropNex presentation materials, reproduced from the author’s supplied latest presentationslide 16.
Interpretation limits:Includes unsold private residential and EC units with planning approval. Unsold stock, vacancies and upcoming completions are different measures. The bars do not label every value; exact inventory is not estimated from the image.
Click to view the high-resolution original ↗
As demand grows, the pace of new supply and completion matters. If population and household demand persistently grow faster than residential supply, the balance can tighten and put upward pressure on prices. This is an important reason for my positive view of the fundamentals.
The chart shows unsold new-home supply. My focus is whether supply can be replenished in time as demand grows, and whether buyers have sufficient choice for their preferred location, total budget and move-in date.
Private and landed homes: supply structure shapes scarcity
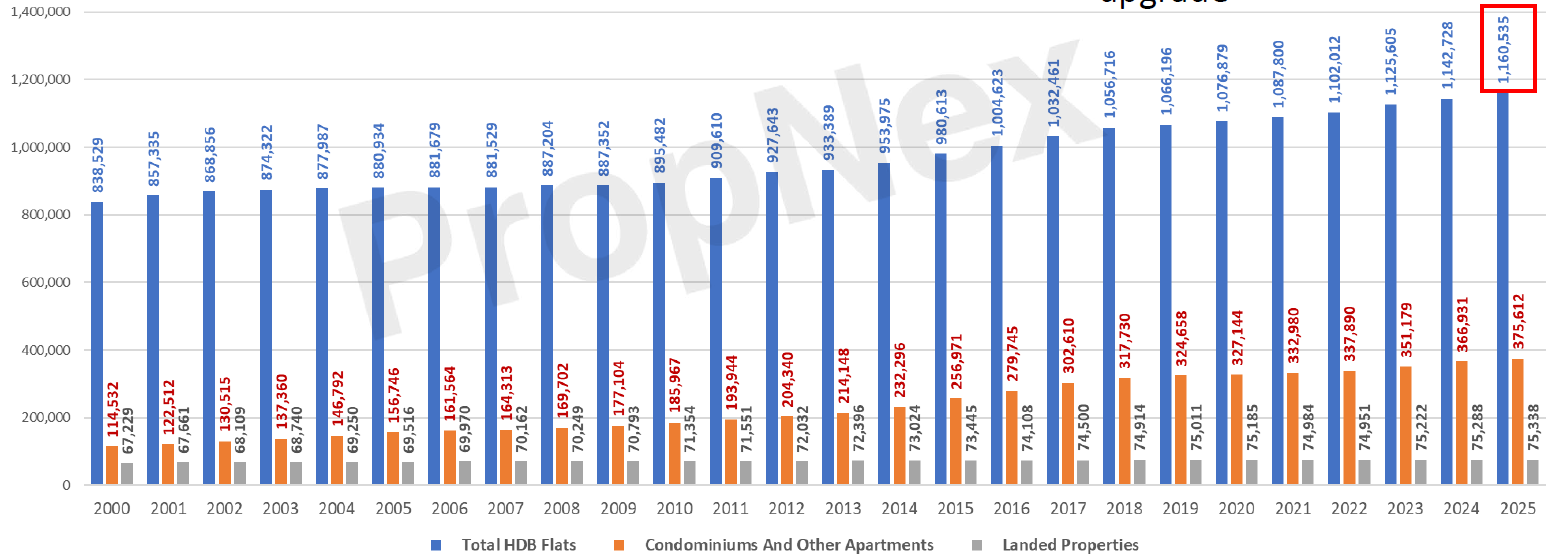
Source:Original chart: PropNex presentation materials, reproduced from the author’s supplied latest presentationslide 23.
Interpretation limits:The chart shows 1,160,535 HDB flats, 375,612 condominiums and other apartments, and 75,338 landed homes in 2025. These are the three stock categories shown, not available-for-sale inventory or the number of resident households.
Click to view the high-resolution original ↗
HDB flats dominate Singapore’s housing stock. Private apartment supply is comparatively limited, and landed homes are scarcer still. In my view, demand to upgrade into private homes and the difficulty of greatly expanding landed supply support their long-term value. Within budget, buyers should compare location, product quality and scarcity together.
Financial wealth has grown faster, leaving opportunities in relative residential value.
Around 2013: financial assets begin outpacing residential assets
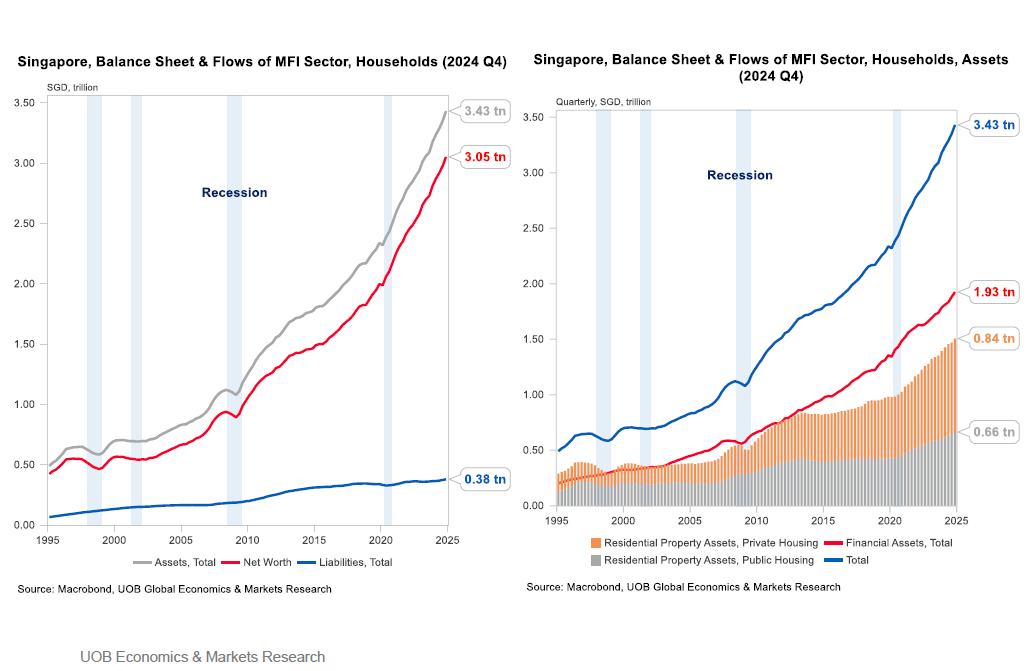
Source:Original chart credits: Macrobond and UOB Global Economics & Markets Research; reproduced from the author’s supplied latest presentationslide 21.
Interpretation limits:Q4 2024 total assets are approximately S$3.43 trillion, net worth S$3.05 trillion and liabilities S$0.38 trillion. All are nominal aggregates. Asset totals are also affected by quantities held and changes in composition. The chart alone does not establish that individual home prices are undervalued.
Click to view the high-resolution original ↗
The chart shows a notable shift in Singapore’s household balance sheet around 2013. Before then, financial and residential assets were closer in scale. Financial assets subsequently grew faster, reducing residential assets’ relative share of total household assets.
My interpretation is that continuing property cooling measures, which restrained capital entering real estate, are important context for this shift. Different growth rates in financial and residential assets reflect changes in wealth accumulation and property allocation.
In my view, Singapore home prices have not expanded at the same pace as household financial wealth. From this perspective, relative residential valuations remain reasonable, with potential value opportunities worth investigating.
This is my investment interpretation of changes in the asset mix. Assessing a specific home still requires its actual entry price, comparable transactions and product scarcity; an aggregate asset chart cannot independently prove undervaluation.
Today’s land costs are reshaping tomorrow’s new-home pricing benchmarks.
Land is a core development cost. What developers pay for land today provides an important reference for future project costs and positioning. Higher land prices mean the next round of supply starts from a higher cost base.
In my view, rising land costs put upward pressure on future launch prices. Today’s land transactions are therefore an important clue to future pricing benchmarks.
Land costs across locations outline the new-home cost base
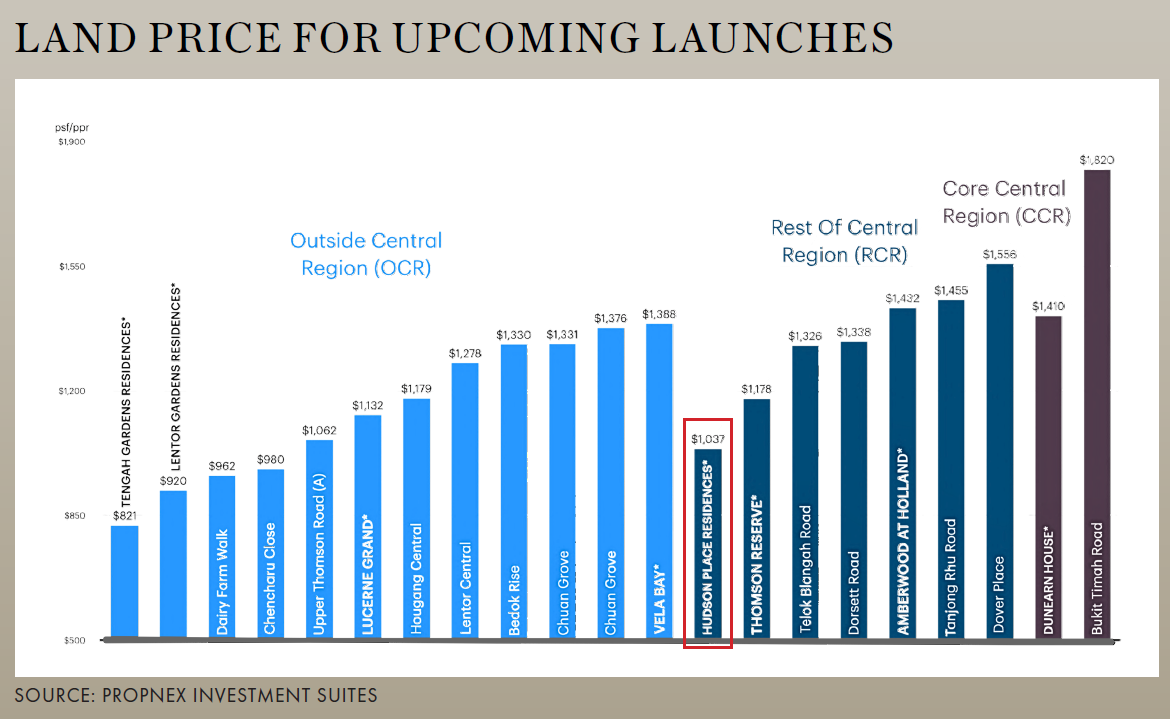
Source:Original chart credit: PropNex Investment Suites; reproduced from the author’s supplied latest presentationslide 22.
Interpretation limits:Values are land costs per square foot per plot ratio (psf ppr), not sale prices per square foot of residential saleable area. Some regional classifications differ from other presentation pages; headings alone should not be used to rank locations.
Click to view the high-resolution original ↗
Cross-location comparisons suggest changes in relative cost bases. Some newer suburban sites have land costs approaching those of earlier city sites. In my view, projects acquired earlier with attractive locations and products merit closer comparison of their actual selling prices.
The recent Lentor land-cost rebound raises subsequent development costs
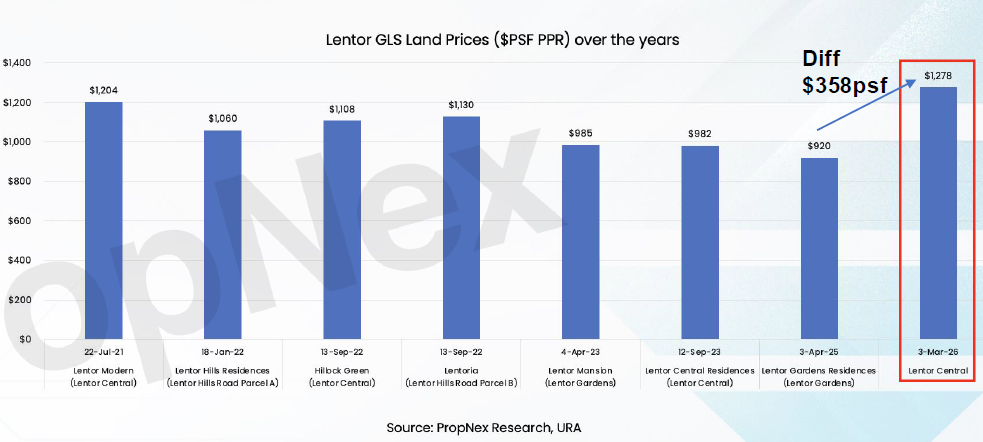
Source:Original chart credits: PropNex Research and URA; reproduced from the author’s supplied latest presentationslide 10.
Interpretation limits:The chart’s S$920 figure in 2025 and S$1,278 figure in 2026 differ by S$358, or around 38.9%. However, the 2021 figure was already S$1,204. Site conditions and tender timing differ.
Click to view the high-resolution original ↗
In the Lentor chart, the 2026 site at around S$1,278 psf ppr is approximately 38.9% above the 2025 site shown at S$920. A rebound in land costs raises the starting cost for subsequent projects. In my view, this shifts local new-home pricing benchmarks upward and makes earlier projects’ pricing worth examining.
These are different sites. The chart shows around S$1,204 psf ppr in 2021, followed by a decline. The 38.9% describes the difference between the two listed 2025 and 2026 transactions, not uninterrupted increases across all suburban sites or years.
Higher city land costs influence future pricing benchmarks
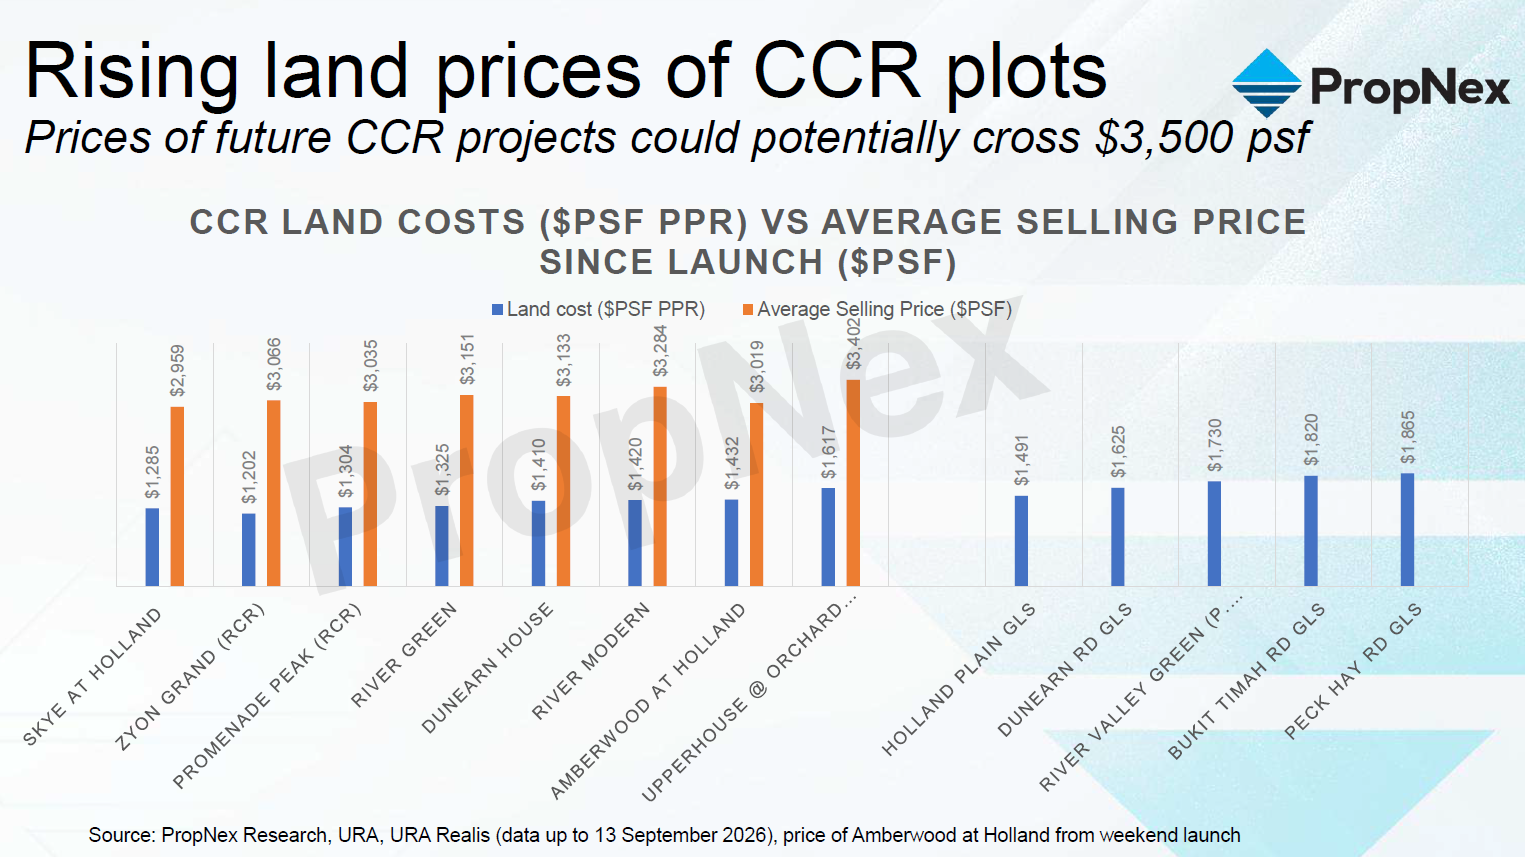
Source:Original chart credits: PropNex Research, URA and URA REALIS; reproduced from the author’s supplied latest presentationslide 30.
Interpretation limits:Blue bars show land costs; orange bars show average selling prices of launched projects. The right-hand sites show land costs only. The heading suggesting a future level above S$3,500 is a research view, not a transacted price or official forecast.
Click to view the high-resolution original ↗
The city chart compares land acquisition costs with selling prices of launched projects. Higher recent land costs raise the development base for the next city launches. In my view, rising costs in city and some suburban sites together change the pricing reference buyers may face; the effect depends on acquisition timing and product positioning.
A nearby Upper Thomson site has land costs around 36.8% higher
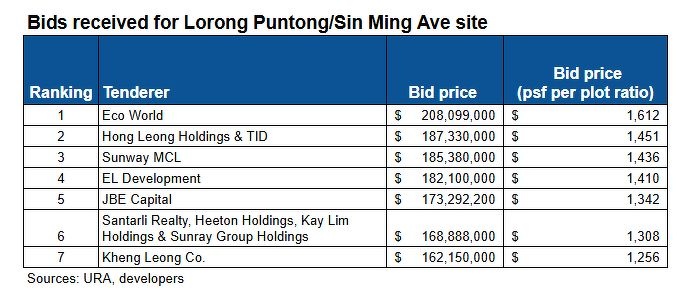
Source:Original chart credits: URA and developers; reproduced from the author’s supplied latest presentationslide 33.
Interpretation limits:The original chart’s top bid is S$208,099,000, around S$1,612 psf ppr, with the lowest at around S$1,256. The top bidder was Eco World Development (S) Pte Ltd. Its 18 September 2026 announcement confirmed the 99-year lease award at S$208,099,000 with maximum permissible GFA of around 11,994 sq m. S$1,612 is land cost based on GFA, not a home selling price.
Click to view the high-resolution original ↗
Using the published psf ppr land-cost figures, the Lorong Puntong / Sin Ming Avenue site near Upper Thomson, at around S$1,612, is approximately 36.8% above Thomson Reserve’s around S$1,178.
Subsequent projects in the area therefore begin with substantially higher land costs. In my view, this can move future local launch benchmarks upward and makes Thomson Reserve’s earlier land-acquisition advantage worth examining. The ultimate question is whether that advantage is reflected in the price the buyer actually pays.
Checked on 22 October 2026: Eco World Development (S) Pte Ltd was the award recipient; S$208,099,000 was the award consideration; around S$1,612 is calculated using permitted GFA. See EcoWorld’s 18 September 2026 announcement. Thomson View’s S$810 million was the acquisition consideration; around S$1,178 includes land betterment charges for intensification and the premium to renew the lease to 99 years. See EDMUND TIE’s 25 November 2024 announcement. The published land costs provide a benchmark comparison. Thomson’s bonus floor area and final premium breakdown are not fully disclosed in that announcement. The 36.8% is neither a fully normalised, audited cost difference nor a home selling-price difference.
My pricing scenario: what would a benchmark increase of at least 30% require?
Setting aside short-term volatility, I personally consider a rise of at least 30% in subsequent local launch pricing benchmarks relative to earlier low-land-cost projects to be relatively likely. This is my scenario assessment, based on higher land costs alongside construction, financing and development expenditure. It does not mean Thomson Reserve must appreciate by 30% from today’s purchase price.
| Amount per square foot (S$) | Earlier cost baseline | Higher land cost only | Higher land and other costs |
|---|---|---|---|
| Land cost / GFA | 1,178 | 1,612 | 1,612 |
| Construction, financing, taxes and other development costs / GFA | 700 | 700 | 850 |
| Total cost / GFA | 1,878 | 2,312 | 2,462 |
| 15% cost markup; assumed saleable area / GFA of 100% | 2,160 | 2,659 | 2,831 |
| Change in pricing benchmark | Baseline | +23.1% | +31.1% |
Model dated 22 October 2026. Selling price = (land cost + other development costs) × 1.15 ÷ (saleable area / GFA). The 15% is a cost markup, not a net sales margin. To illustrate transmission, all three columns assume saleable area / GFA of 100%; actual project ratios were not obtained. Demolition, building specifications, financing duration and sales pace affect results. The values 700, 850 and 15% are scenario inputs, not verified costs. With other costs unchanged, the land difference implies only about a 23.1% modelled price difference. Reaching 30% requires other costs to rise from 700 to at least around 829, or additional effects from area efficiency, margins or other factors. This illustrates the conditions for 30%; it is not statistical evidence of a higher probability. That probability assessment is Kevin’s personal view. The starting point is a hypothetical earlier-cost selling-price benchmark, not today’s published starting price or a buyer’s transaction price.
Earlier land acquisition creates room for a cost advantage. Compare that room with actual quotations, usable area and same-budget alternatives to determine whether buyers receive the benefit.
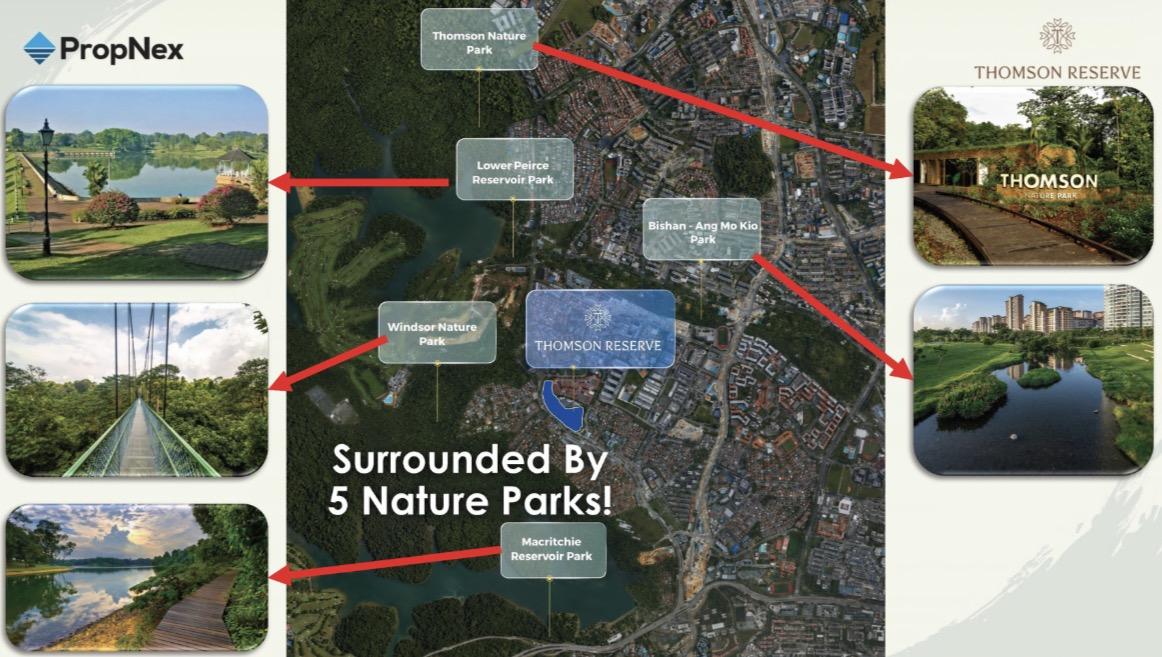
Real scarcity combines location, environment and everyday efficiency.
Housing scarcity must translate into daily use: an established location, transport, natural surroundings and space that suits a family. In my view, assets combining these conditions merit long-term consideration. Assess layouts through furniture scale, corridors, daylight, storage and family activities.
An established location is more than a label. Rail, shopping, dining, schools and nature must work together along everyday routes to remain useful to families. A seemingly larger home may be a less suitable upgrade if it adds daily commuting time.
Capital return
Assess price and demand potential after deducting costs.
Time return
Time saved on commuting, school runs and errands can return to the family.
Lifestyle return
Consider whether space, quiet, nature and convenience remain useful over time.
Imagine an ordinary weekday: groceries collected on the way home, children reaching activities without waiting for a parent’s car, and older relatives visiting the mall independently. These improvements do not depend on a future sale to be realised. They distinguish a home from a purely financial asset, although families value conveniences differently.
If an actual route saves 20 minutes a day over 220 working days, it returns roughly 73 hours a year to the family. This is a personal time-return scenario; actual savings depend on the location and daily routes.
Lifestyle benefits also have costs. More facilities call for questions about management fees, upkeep and peak-time use. Proximity to nature requires checking entrances, walking paths and unit orientation. Scarcity needs practical usability and must fit the budget.
Thomson Reserve: testing growth, scarcity and cost advantages against the entry price.
Thomson Reserve brings together Upper Thomson’s established amenities, operating rail access, nature, a large site and family-oriented homes. In my view, it has notable scarcity attributes and an earlier land-cost advantage. Buyers’ central task is to determine whether actual quotations reflect those values.
Upper Thomson MRT is already operating, so rail convenience can be tested in daily life. Walk from the specific block to the station, then assess the entire journey to work, school and older relatives. [8]
Thomson Plaza, dining and natural surroundings provide a foundation for everyday life. NParks materials provide more information on public nature areas around the Central Catchment and MacRitchie. School distances, registration phases and eligibility must be checked against the relevant year’s official rules; a nearby school does not guarantee a place. [9]
The developer’s 15 October materials describe around five hectares and 1,268 homes, with about 88% of land allocated to landscaping, water features and facilities, a building footprint around 12%, and three planned clubhouses. The 88% is not purely a greenery ratio or private space for each home. A large site creates facility possibilities but also requires scrutiny of management and usage efficiency. [10]
| Type | Example area | Published starting price |
|---|---|---|
| 2 bedrooms | 592 sqft | S$1,544,000 |
| 3 bedrooms | 947 sqft | S$2,503,000 |
| 4 bedrooms | 1,238 sqft | S$3,388,000 |
Starting prices apply to specific units, not all floors and orientations, and do not represent current available inventory. Personal taxes and other transaction costs are excluded. Source: [10].
If your budget is near the three-bedroom starting price, compare what the same total budget buys in nearby resale developments in terms of size, age and move-in timing. If immediate occupancy matters more, include the construction wait and interim rent. A lower psf does not necessarily mean a lower total price or a better family fit.
| Research dimension | Potential value | Checks required |
|---|---|---|
| Established neighbourhood | Integrated transport, errands and family activities | Actual walking routes, noise and peak-hour journeys |
| Natural environment | Supports sustained outdoor living | Accessible entrances, opening status and specific orientation |
| Large community | Choice of facilities and family space | Management fees, maintenance, crowding and privacy |
| Cost base | Earlier land acquisition with a published land-cost advantage | Normalise cost definitions and check actual unit prices |
| Holding and exit | Family demand may provide long-term support | Similar-unit competition across 1,268 homes, completion-period supply and buyer budgets |
The development has a 99-year lease. Developer materials state a lease commencement of 14 July 2026 and estimated TOP in the second half of 2030. Construction time, remaining lease, maintenance and future resale competition are all costs. If another project offers a better total price, area or commute after comparison, choosing it is equally consistent with this framework. [10]
Upgrade or wait: let your circumstances support the decision.
Buying at the right price has two dimensions: value relative to the market and alternative properties, and affordability relative to your finances and family plans. A market opportunity may exist without immediate action being suitable. Conversely, clear family needs and robust finances can justify starting comparisons before every macro variable is settled.
I suggest writing the final judgment in three lines. First: what exactly does the upgrade improve, and which requirements are non-negotiable? Second: what is the full cash flow through purchase and transition, and can you keep holding in an adverse scenario? Third: who might buy it later, and why would they pay that total price? If these remain unclear, waiting and further research are valuable work.
My view is that sustained economic and wealth growth, support for population-driven demand and higher costs at some new sites provide long-term support for Singapore housing. Families’ next step is to use actual prices, cash flow and improvements in daily life to decide when to upgrade.
Share Singapore's Growth.
Own Scarce Assets.
Buy at the Right Price. Share Singapore’s growth. Own scarce assets. Buy at the right price.
This is general market research and housing-choice analysis, not individual financial advice or a promise of returns. Historical performance, research scenarios and developer materials cannot guarantee future returns.
Sources, definitions and image records
Content revision and land-source checks: 22 October 2026. Original presentation/transcript compilation: 20 October 2026. The core argument follows the author’s 45-slide presentation and Kevin’s accessible Zoom speech transcript from 19 October. The available transcript jumps from the macro introduction to an on-site tour and does not cover the entire lecture. Missing sections are not represented as verified speech, and promotional remarks by other speakers are not quoted. Misrecognised index levels in the transcript are resolved using the original presentation charts.
- IMF:World Economic Outlook, October 2026 — Resilience Under Strain, Urgent Choices. Global growth, inflation and risks are forecasts and scenarios.
- MAS: Monetary Policy Statement, 14 October 2026. Local growth conditions, inflation forecasts and the exchange-rate policy framework.
- Government economic release: 2026 GDP growth forecast raised to 4.5%–5.5%. A full-year growth forecast, not a home-price forecast.
- URA: Private Residential Properties data portal. Consult prices, rents, supply and stock under their original definitions. This article did not download and recompute the full underlying datasets for the presentation charts.
- SingStat:Population Trends, 2026, 25 September 2026. Household-size comparisons use 2015/2025 definitions. Chart 3’s status grants and targets follow the original credits and are not mixed with population stock.
- SingStat: Household Sector Balance Sheet data portal. Chart 6 uses the presentation’s UOB/Macrobond Q4 2024 snapshot; it is not labelled as the latest 2026 wealth statistic.
- Singapore Land Group: update on the Thomson View collective acquisition, 25 November 2024. S$810 million is the total acquisition consideration.
- LTA: TEL Stage 2 opened to passengers on 28 August 2021。
- NParks:Central Catchment Nature Reserve. Access to nature areas, entrances and visits is subject to opening rules.
- CapitaLand:UOL Group and CapitaLand Development to unveil Thomson Reserve, 15 October 2026. Project scale, land allocation, tenure, starting prices and estimated progress are developer information, not independent valuations.
- Kevin Feng’s latest presentation: Upgrade or Wait in 2026? Key Property Decisions. Revised on 22 October 2026. Original charts are retained, with presentation slide numbers and original credits identified for each of the ten charts;machine-readable image source record。
- EcoWorld: award announcement for Lorong Puntong / Sin Ming Avenue, 18 September 2026; award recipient, consideration, 99-year lease and permitted GFA.
- EDMUND TIE: Thomson View collective-sale announcement, 25 November 2024; S$1,178 psf ppr includes land betterment charges and the lease-renewal premium. Checked on 22 October 2026.
Image use record:The ten data charts, cover rendering (slide 41) and nature illustration (slide 38) were extracted from the presentation supplied by the author for this article, retaining original credits and watermarks. Chart rights belong to the credited owners, including PropNex and UOB/Macrobond. Project renderings, maps and photographs belong to their respective owners. Supply of materials for this article does not grant an open republication licence or third-party reuse rights. Internal slides marked as not for circulation were not used. Kevin’s portrait uses existing website material. Renderings and diagrams do not represent current conditions, measured distances or final delivery.
← All Property Intelligence articles Browse featured listings ↗