New-home sales rose 93.5% month on month in September, but prices per square foot did not rise alongside them. Across new homes, resale and commercial property, the mix of transactions matters more than the headline change alone.
My assessment: September does not establish a broad market rebound or an industry-wide developer price cut. It shows a recovery in activity, divergence in transaction prices and resilience in resale housing. The next comparison should examine each asset’s entry price, product strengths and holding costs, alongside its region and price per square foot.
1. New-home sales rise 93.5%: has the market suddenly heated up?
According to the URA data compiled by PropNex Research, 296 new private homes were sold in September 2026, compared with 153 in August: 40 in the CCR, 131 in the RCR and 125 in the OCR. The increase is substantial, but August’s Lunar Seventh Month lull and absence of new project launches created a low comparison base.
Amberwood at Holland sold 24 units in September. Units released for sale increased from 116 in August to 158 in September. The more measured reading is a recovery in activity as supply resumed, rather than evidence from one monthly comparison that demand expanded sharply.
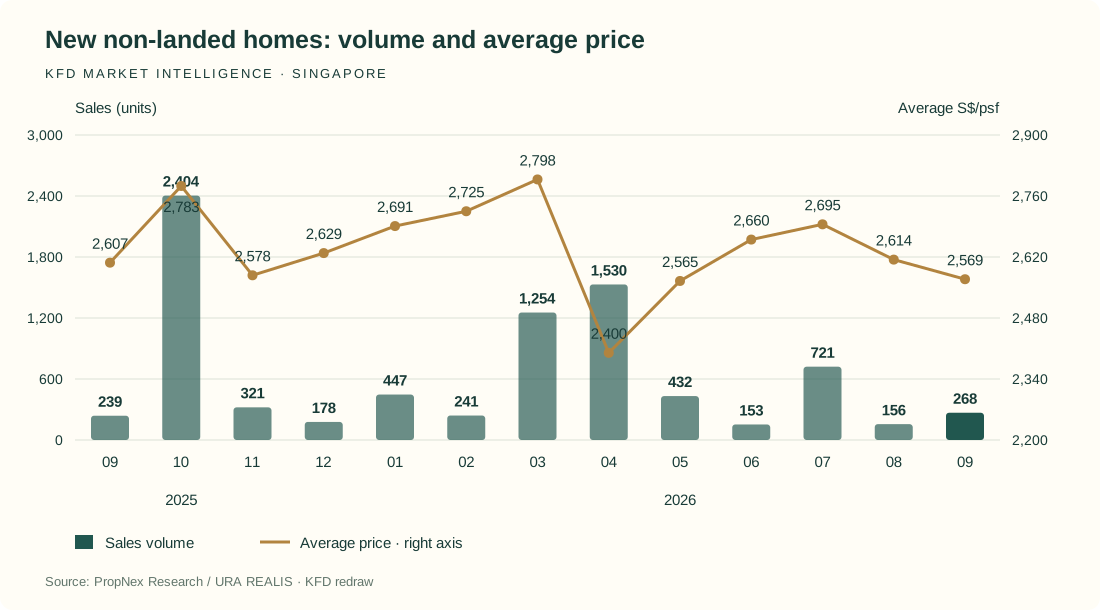
Source: PropNex Research / URA REALIS · October 2026 monthly report, page(s) 7 · Redrawn by KFD from source statistics.
View chart data
| Month | Sales (units) | Average S$/psf |
|---|---|---|
| 2025-09 | 239 | 2,607 |
| 2025-10 | 2,404 | 2,783 |
| 2025-11 | 321 | 2,578 |
| 2025-12 | 178 | 2,629 |
| 2026-01 | 447 | 2,691 |
| 2026-02 | 241 | 2,725 |
| 2026-03 | 1,254 | 2,798 |
| 2026-04 | 1,530 | 2,400 |
| 2026-05 | 432 | 2,565 |
| 2026-06 | 153 | 2,660 |
| 2026-07 | 721 | 2,695 |
| 2026-08 | 156 | 2,614 |
| 2026-09 | 268 | 2,569 |
2. What does a 5% decline in the RCR new-home median mean?
September’s median price per square foot for non-landed new homes fell across the three regions: CCR S$3,050 psf (−0.3%), RCR S$2,522 psf (−5.0%) and OCR S$2,336 psf (−0.1%). The RCR warrants closer examination, but the result does not mean every condominium there was discounted by 5%.
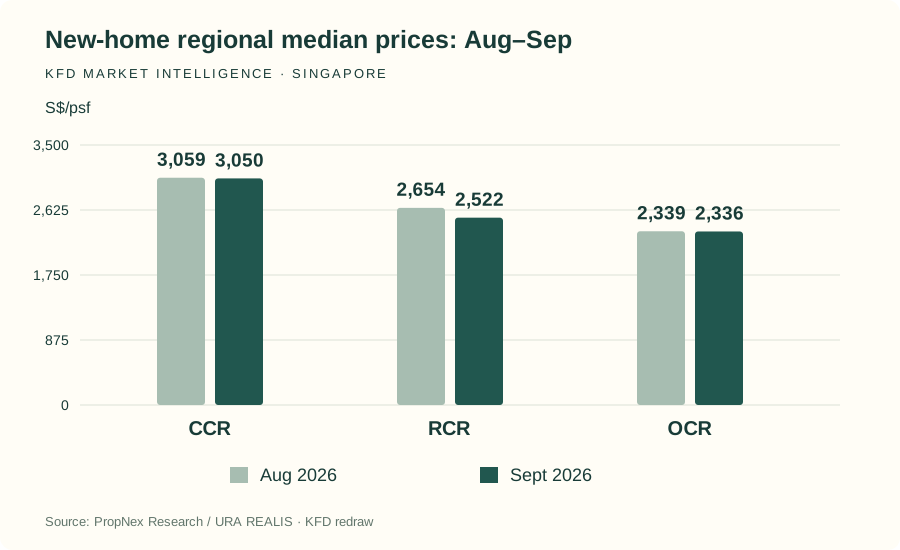
Source: PropNex Research / URA REALIS · October 2026 monthly report, page(s) 8 · Redrawn by KFD from source statistics.
View chart data
| Region | 2026-08 | 2026-09 |
|---|---|---|
| CCR | 3,059 | 3,050 |
| RCR | 2,654 | 2,522 |
| OCR | 2,339 | 2,336 |
The monthly report links the RCR change to stronger sales at Terra Hill following a price adjustment and a larger share of transactions at The Sen. Changes in the projects and unit types sold can move the regional median.
A price assessment therefore needs to move beyond regional statistics to the same development, comparable layouts, and similar floors and orientations, before deciding whether a developer’s reduction is meaningful.
3. Resale volumes ease, while prices remain resilient
Resale transactions declined from 985 in August to 954 in September. The average price rose slightly from S$1,821 to S$1,826 psf (+0.3%). In the monthly report’s series, average resale prices have remained above S$1,800 psf since February 2026.
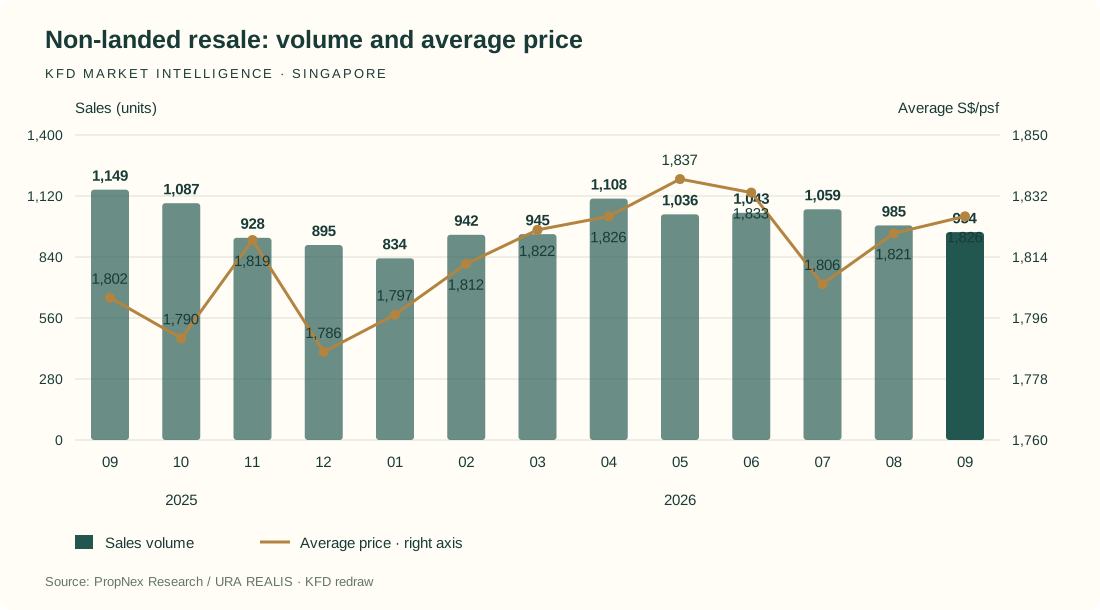
Source: PropNex Research / URA REALIS · October 2026 monthly report, page(s) 12 · Redrawn by KFD from source statistics.
View chart data
| Month | Sales (units) | Average S$/psf |
|---|---|---|
| 2025-09 | 1,149 | 1,802 |
| 2025-10 | 1,087 | 1,790 |
| 2025-11 | 928 | 1,819 |
| 2025-12 | 895 | 1,786 |
| 2026-01 | 834 | 1,797 |
| 2026-02 | 942 | 1,812 |
| 2026-03 | 945 | 1,822 |
| 2026-04 | 1,108 | 1,826 |
| 2026-05 | 1,036 | 1,837 |
| 2026-06 | 1,043 | 1,833 |
| 2026-07 | 1,059 | 1,806 |
| 2026-08 | 985 | 1,821 |
| 2026-09 | 954 | 1,826 |
The regions did not move together. Median resale prices were S$2,154 psf in the CCR (+0.1%), S$1,997 in the RCR (+1.9%) and S$1,560 in the OCR (−0.4%). These are medians of that month’s transaction sample, rather than measured monthly appreciation of the same properties.
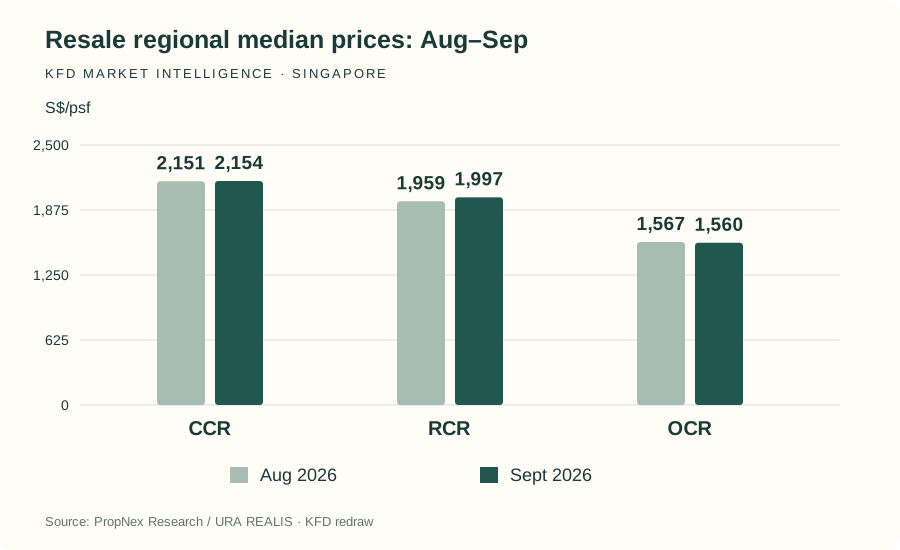
Source: PropNex Research / URA REALIS · October 2026 monthly report, page(s) 13 · Redrawn by KFD from source statistics.
View chart data
| Region | 2026-08 | 2026-09 |
|---|---|---|
| CCR | 2,151 | 2,154 |
| RCR | 1,959 | 1,997 |
| OCR | 1,567 | 1,560 |
Projects with relatively active trading included Parc Esta, JadeScape, Normanton Park and The Florence Residences. Larger developments often provide more resale evidence, extensive facilities and identifiable tenant and owner-occupier demand. Each unit still requires checks on rental yield, maintenance fees, layout and competing supply.
D’Leedon, Hillcrest Arcadia and Icon, which appeared among September’s more actively traded CCR developments, are established projects. Some buyers continue to value mature locations and distinctive assets. Their limited monthly transaction counts do not establish that older condominiums generally outperform newer ones.
4. New-versus-resale price gaps narrow: where might value emerge?
Subtracting regional median resale prices from new-home medians provides an initial indicator of the new-home premium. The RCR gap narrowed from S$695 psf in August to S$525 in September; the CCR gap declined from S$908 to S$896, while the OCR gap increased slightly from S$772 to S$776.
| Region | August gap | September gap | Change |
|---|---|---|---|
| CCR | S$908 | S$896 | −S$12 |
| RCR | S$695 | S$525 | −S$170 |
| OCR | S$772 | S$776 | +S$4 |
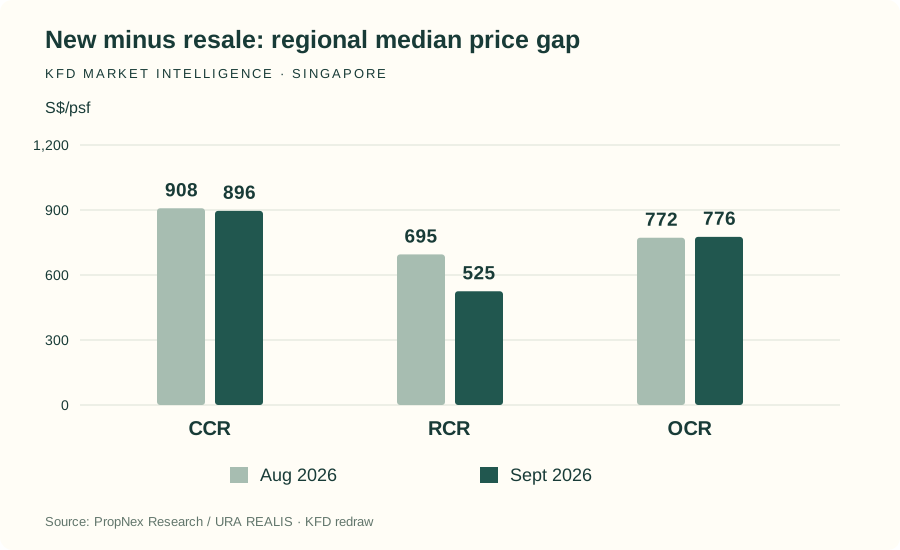
Source: PropNex Research / URA REALIS · October 2026 monthly report, page(s) 15 · Redrawn by KFD from source statistics.
View chart data
| Region | 2026-08 | 2026-09 |
|---|---|---|
| CCR | 908 | 896 |
| RCR | 695 | 525 |
| OCR | 772 | 776 |
A narrower gap may bring new-home pricing closer to resale alternatives, but can also reflect a different mix of sales. August’s limited new-home sample makes monthly comparisons particularly volatile. The figures do not establish that RCR new homes have become uniformly cheap.
Compare specific new developments with nearby resale homes offering similar utility. Review total quantum, usable space, age, remaining lease, renovation costs, completion timing, financing and future rental prospects.
5. Commercial and industrial property: examine the mix behind the increase
Commercial and industrial property recorded 179 transactions worth about S$896 million in September, up 2.3% and 3.1% respectively from August. Industrial transaction counts fell from 128 to 124, while their value increased to about S$709 million.
| Asset type | August deals | September deals | September value |
|---|---|---|---|
| Office | 14 | 26 | S$76.48m |
| Retail | 24 | 21 | S$58.87m |
| Shophouse | 9 | 8 | S$51.99m |
| Industrial | 128 | 124 | S$709m |
The approximately S$350 million Advanced Display Park deal accounted for roughly 49% of industrial transaction value. One transaction therefore had a large effect on the monthly total. Higher aggregate value does not establish better liquidity across all commercial properties.
Assess the asset type and its cash flow independently: lease duration, tenant credit, remaining tenure, permitted industrial use, vacancy risk and future capital expenditure matter more than the sector’s headline transaction value.
6. Kevin’s three principles for property allocation
1. New homes: look for a meaningful change in pricing
Shortlist projects with a demonstrable price advantage and verify transactions and available inventory. Developer repricing can create an opening when the project’s quality, total quantum and future resale audience support long-term ownership.
2. Resale homes: verify demand for living and renting
Established locations, larger communities, convenient transport and sensible total prices deserve investigation. Compare completed transactions alongside asking prices, and include renovation, taxes and holding costs in the true entry cost.
3. Commercial property: prioritise dependable cash flow
Rental income, lease terms, remaining tenure, permitted use and exit liquidity often matter more than short-term sales activity. A large deal can change a monthly statistic without changing the investment case for the assets available to an individual buyer.
Property investment is less about predicting next month’s price movement than buying a resilient asset at a reasonable price.
Sources and methodology
This article uses the supplied PropNex October 2026 monthly report, covering September 2026 transactions. Underlying caveat data come from URA REALIS and may change after late lodgements. Overall new-home sales, non-landed new sales and resale samples have different coverage. Averages and medians are identified separately. CCR: Core Central Region; RCR: Rest of Central Region; OCR: Outside Central Region.
Charts are original KFD redraws of numeric statistics, credited to PropNex Research / URA REALIS. Source chart images are not republished. Region charts use the exact labelled August–September values; unlabelled earlier points are not estimated.
- PropNex October 2026 monthly report · pages 5–8, 11–15, 17–19 · Kevin Feng
- URA REALIS · underlying real estate transaction data
Discuss your next property decision
Discuss comparable homes, entry prices and holding costs with Kevin Feng.
Discuss your property plan ↗KFD views are editorial analysis and do not represent official conclusions of PropNex Research or URA. This article is general market commentary, not personalised financial, tax, legal or property advice.